Variance Tracker
Last updated: March 12, 2026
The Variance Tracker helps you quickly answer three key questions about your workforce planning:
Where are we right now? (Total Budget vs. Total Forecast)
What is changing over time? (New hire forecast progression)
Why are we over or under budget? (Variance drivers such as late hiring, pay differences, and unplanned hires)
This tool is designed for Finance teams, Division leaders, and Executives who need a reliable, shared view of workforce cost variance.
Access & Permissions
The Variance Tracker is available to users with the Access Variance tracker permission. This is controlled within Settings > User Management > User Roles.
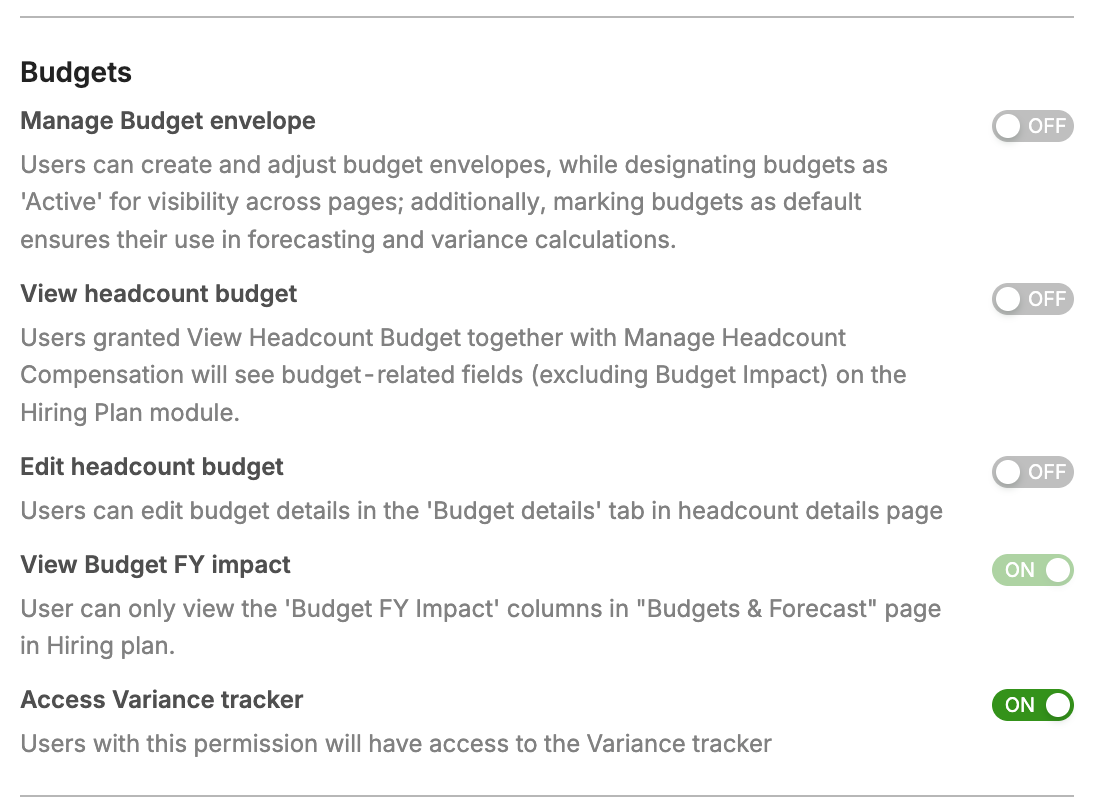
Note: If a user cannot see the Variance Tracker, it is typically a permissions issue.
How it Works
The Variance Tracker compares your organization's forecast against one or more budget envelopes.
To get started, set your context by selecting a time range, applying any relevant filters (such as department, employee type, or headcount type), and choosing the budget envelope you want to benchmark against.

Key Page Controls
Budget Envelope: Select a budget envelope to compare your forecast against.
View Toggle: Switch the lens (e.g., FY or Annualized view) used to calculate the dollar impact across the page.
All widgets will automatically update based on these selections. The headline cards at the top of the page will display your Total Budget, Total Forecast, and Total Budget Variance for the selected view.
Widgets in Variance Tracker
The Variance Tracker includes three primary widgets. Each widget supports toggling between headcount and dollars, depending on your reporting needs.
1. Total Forecast
This widget helps you understand how your workforce forecast is built for the selected period. It displays the starting baseline, current state, planned hiring (To Be Hired/TBH), known attrition, and the resulting forecast.
You can use the grouping dropdown (by Division or by Department) to analyze the forecast rollup by different segments of your organization.
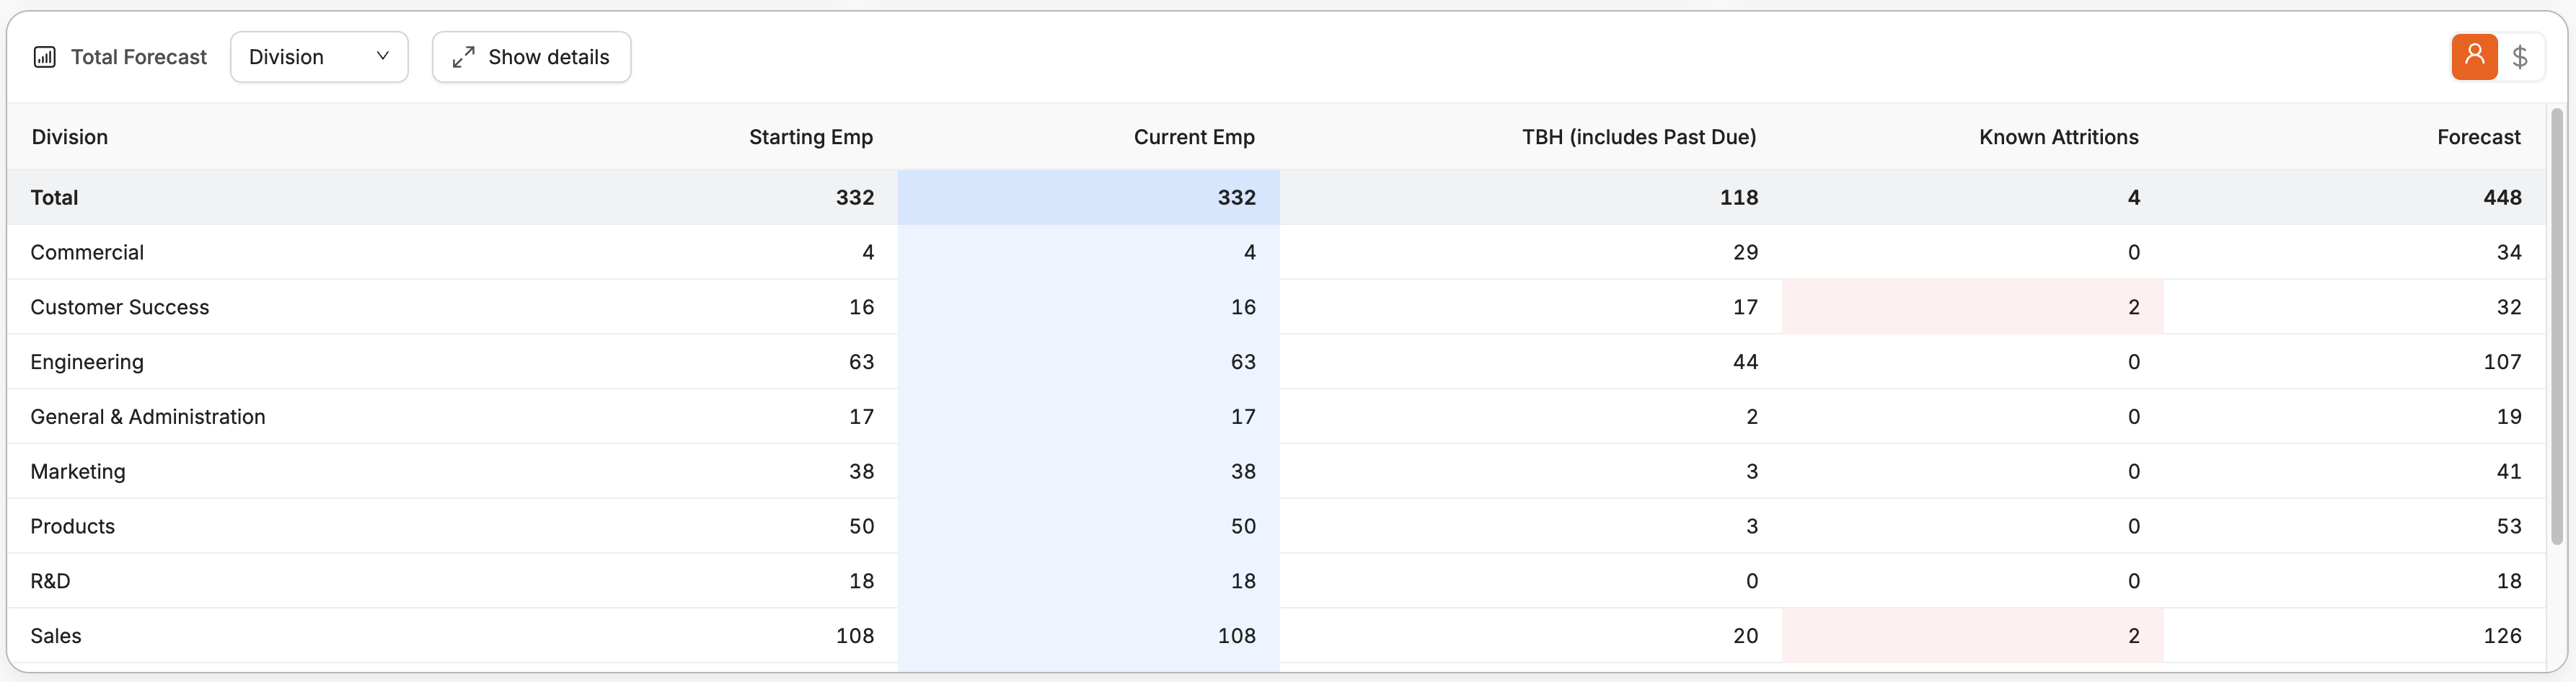
Tip: Click Show details to drill down into the underlying contributors behind the rollup.
2. New Hire Forecast
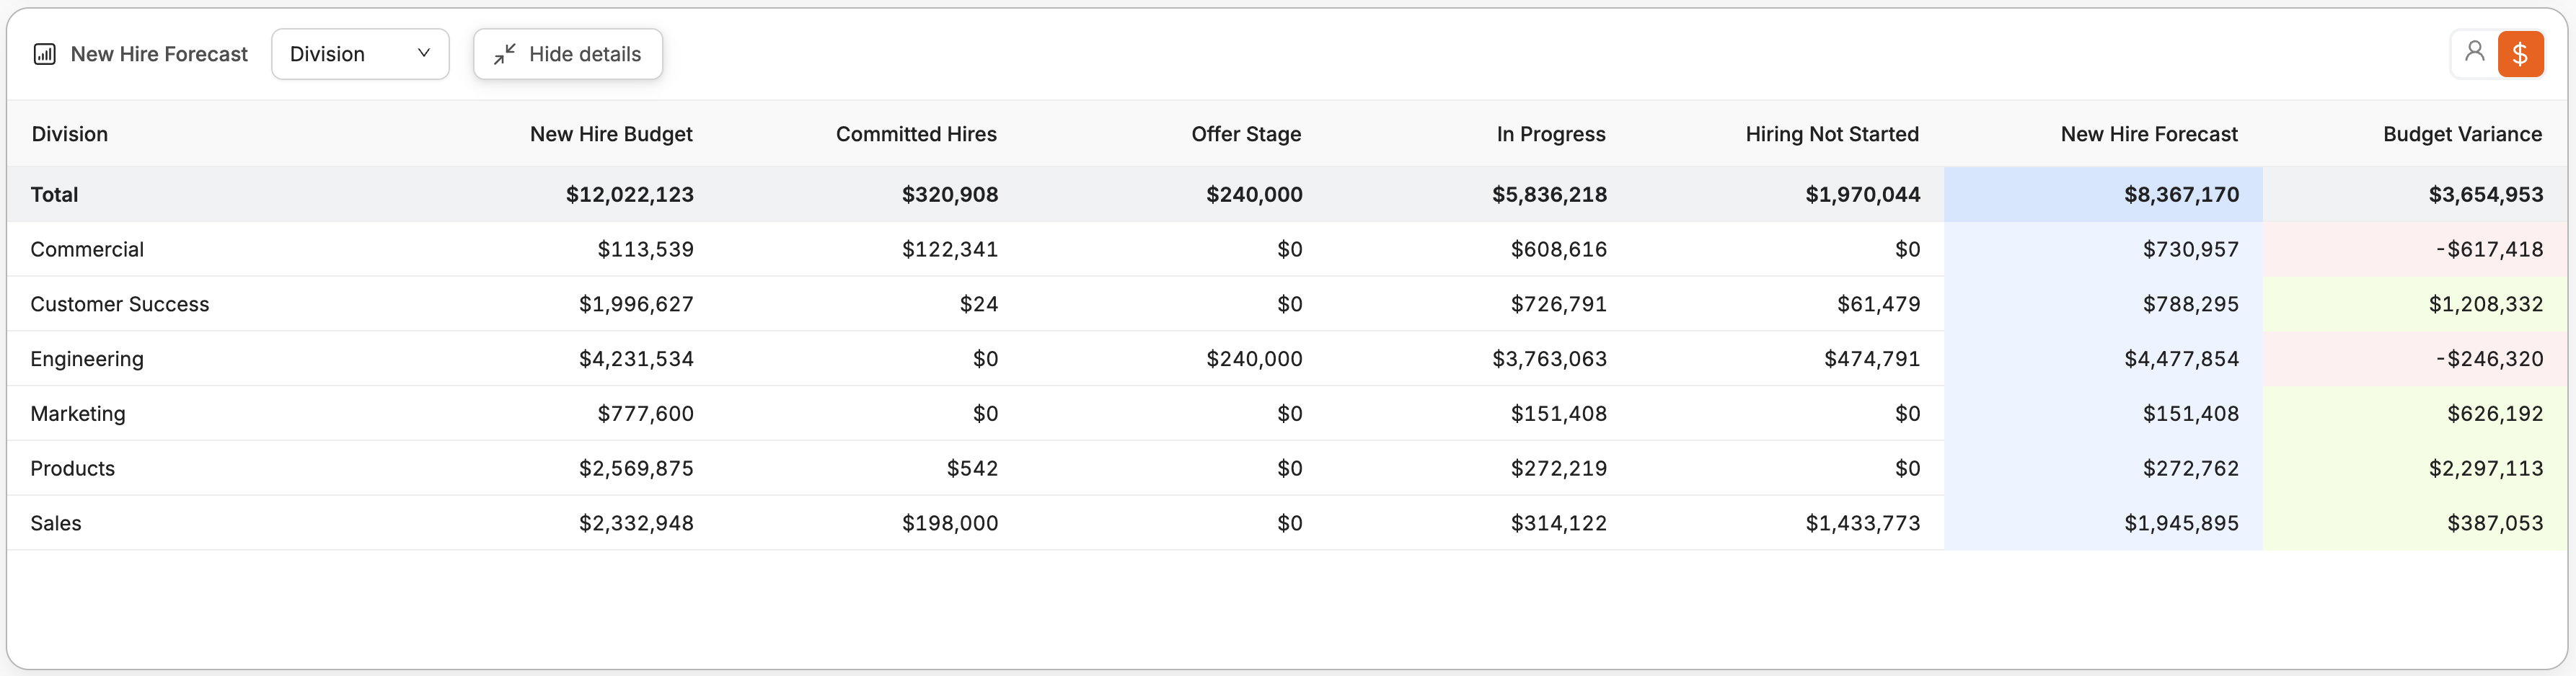
This widget focuses specifically on your hiring plan. It shows how your new hire budget is tracking against the new hire forecast, splitting the data between what is already committed and what is still planned.
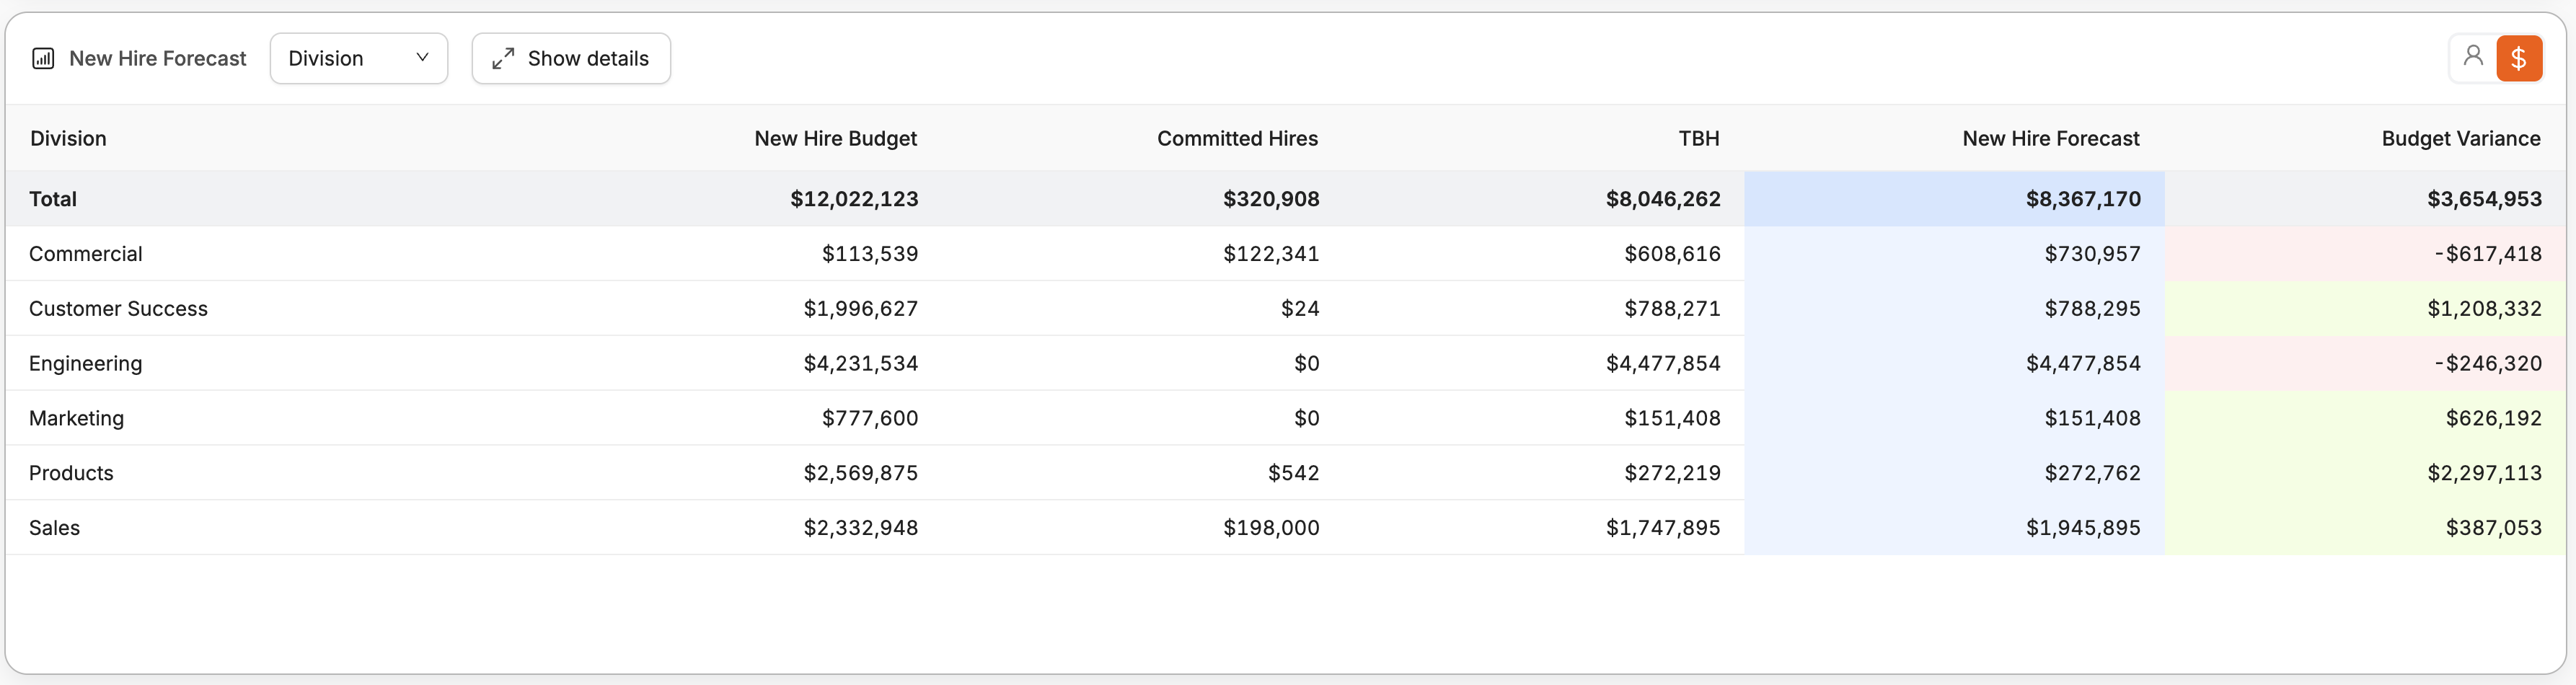
Tip: Use Show details to see a stage-level breakdown of your hiring pipeline (e.g., Offer stage, In progress, Hiring not started).
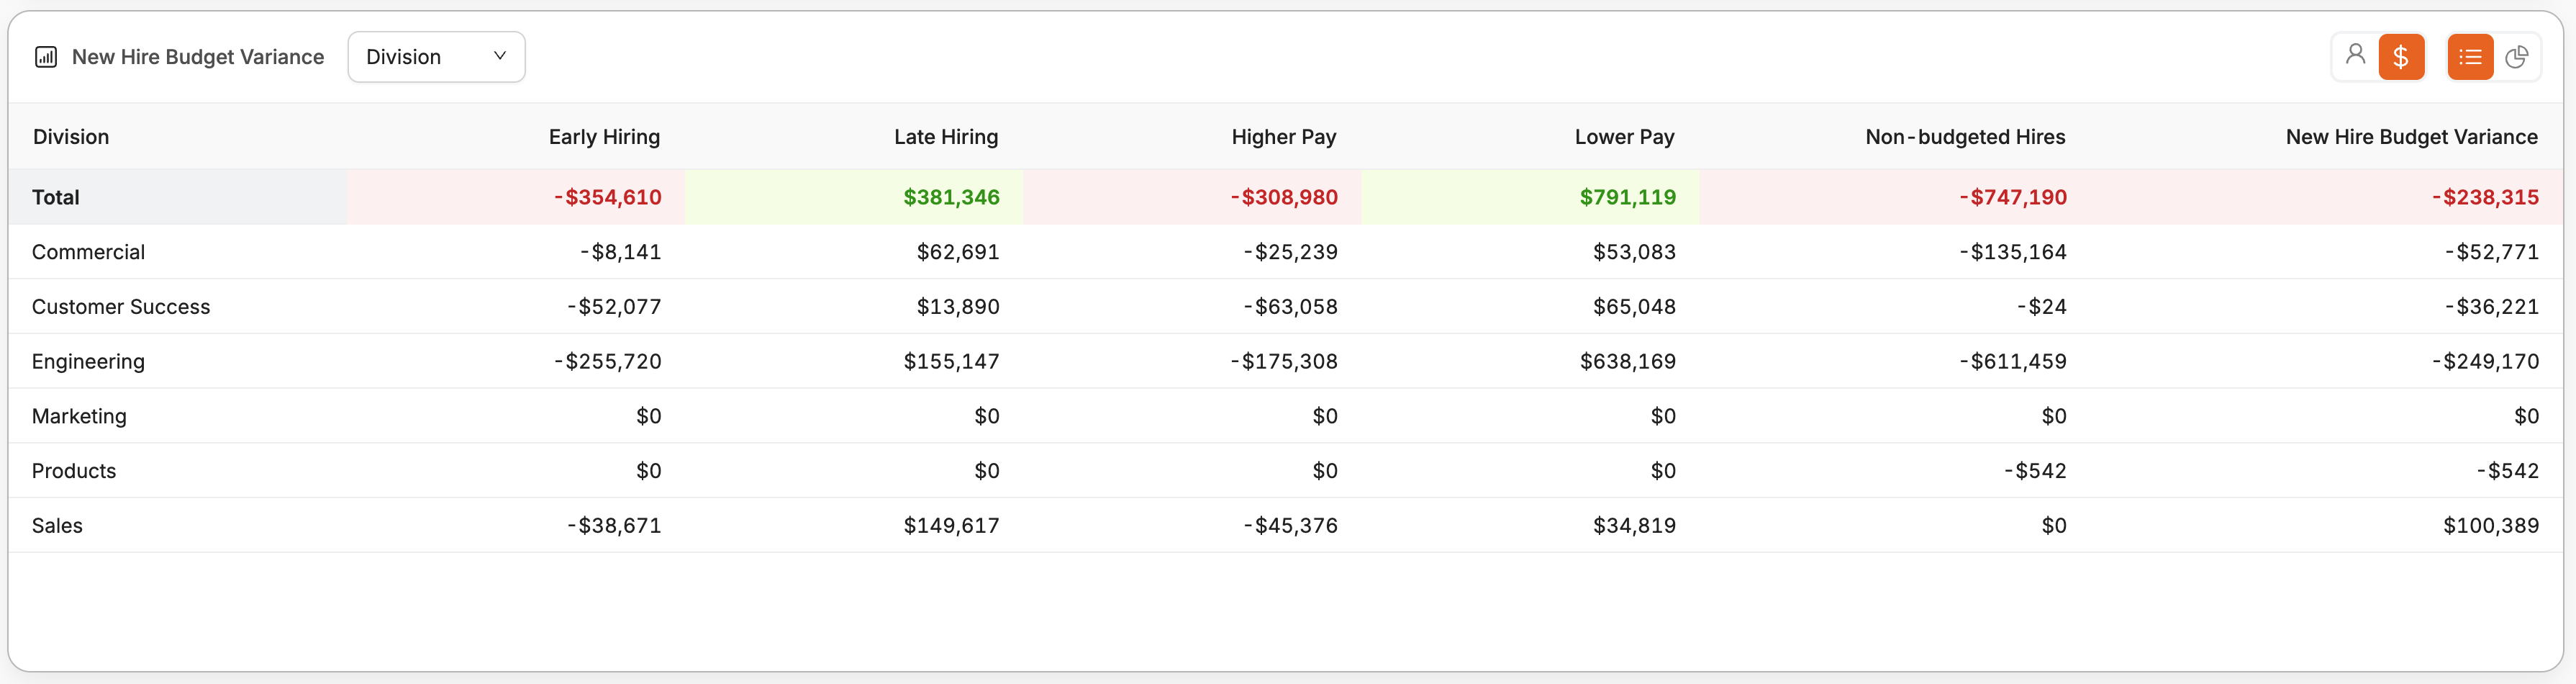
3. New Hire Budget Variance (Drivers)
This chart explains why your new hire forecast is over or under budget by breaking the variance down into clear drivers:
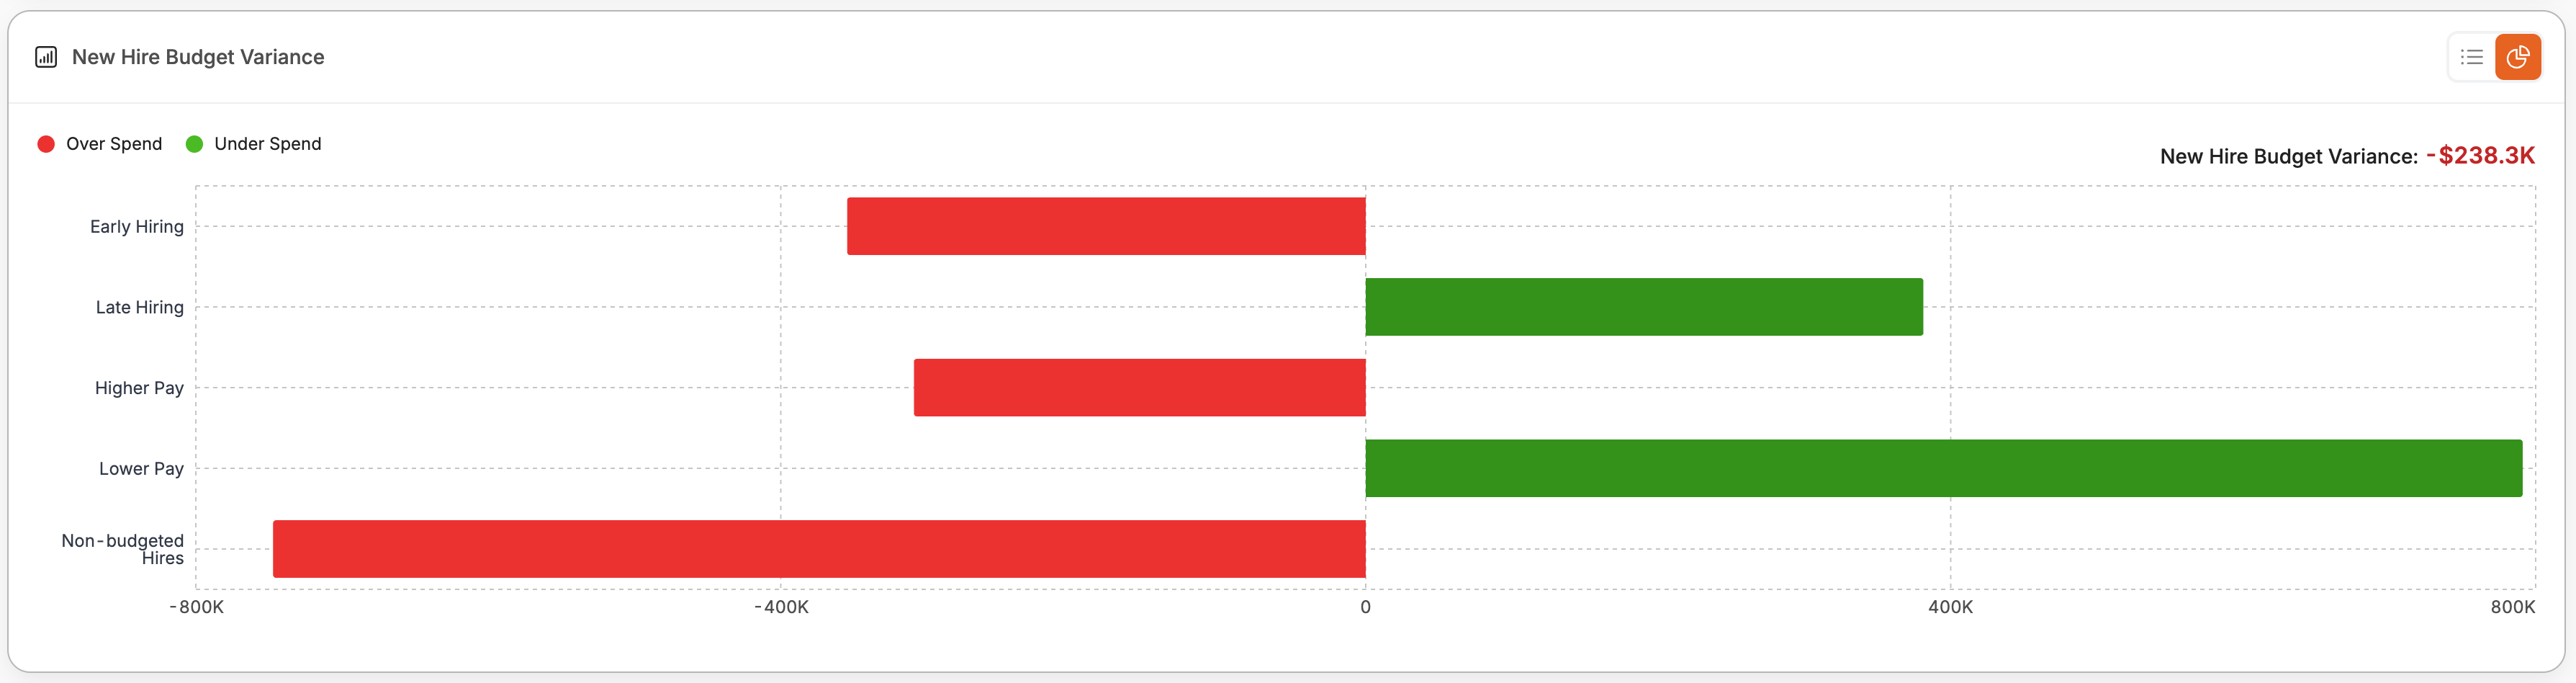
Early hiring: Hiring starts earlier than planned, increasing spend in the current period.
Late hiring: Hiring starts later than planned, shifting spend out of the current period.
Higher pay / Lower pay: Offer compensation differs from your initial budget assumptions.
Non-budgeted hires: Hiring that was not included in the selected budget envelope.
Tip: The New Hire Budget Variance View has options for visualization or table view and the ability to toggle between headcount and dollars within the table view.